
|
Intermediate Macroeconomics | |
1. An Overview of Macroeconomics |
Microeconomics is the study of the behavior of individual economic agents. Microeconomics asks how individuals allocate their time, income and wealth among various opportunities for labor, leisure, consumption, and savings. Microeconomics also studies the process by which individual firms decide on output levels, possibly prices, and the resources that will be used in the production process.
Macroeconomics, on the other hand, is concerned with the economic issues that involve the overall economic performance of the nation, rather than that of particular individuals or firms. Macroeconomics does implicitly deal with the behavior of individual economic agents in the sense that national outcomes are the sum of individual actions. But macroeconomics deals with totals, or aggregate measures of the economy, like national income or average unemployment rates, rather than differences among individuals. Macroeconomics asks how economic aggregates are determined, why problems related to aggregate economic performance occur, and what government can and should do about such problems.
| "Political Economy or Economics is a study of mankind in the ordinary business of life; it examines that part of individual and social action which is most closely connected with the attainment and with the use of the material requisites of wellbeing."
Alfred Marshall, Principles of Economics (1890) Book 1, Chapter 1.
|
| Microeconomics - analysis of the behavior of individual decision-making units (individuals, households, firms).
Macroeconomics - analysis of the behavior of an economy as a whole. |
![]()
One objective of macroeconomics is to develop better laws and government policies to maximize the welfare of society. More specifically, economists focus on several major goals, such as:
This is far from an exhaustive list. Some economists may give higher priority to other goals such as an equitable distribution of income, elimination of the government budget deficit, balanced foreign trade, economic efficiency, reduction of pollution, economic security, and so on. Nevertheless, we highlight these three goals because these are the primary subjects of this course.
Unemployment is always a hot issue. A high unemployment rate may mean the job you have is less secure, or the new job opportunities you hope to consider when you graduate may not exist. For the macroeconomist, unemployment represents a societal rather than personal problem -- unemployed workers do not produce goods and services but they continue to consume them.
Unemployment is reported monthly by the U.S. Bureau of Labor Statistics in the Department of Labor. The Current Population Survey (CPS) is a monthly survey of households conducted by the Bureau of Census for the Bureau of Labor Statistics. The CPS has been conducted in the United States every month since 1940 when it began as a Work Projects Administration project. Each month, 1,500 Census Bureau employees interview 60,000 households for information on the labor force activities (jobholding and jobseeking) or non-labor force status of the members of these households 16 years of age and over during the reference week, Sunday through Saturday, which includes the 12th day of the month. Estimates of the number of persons employed, unemployed, or not in the labor force are derived from the survey. The unemployment rate is the estimated number of unemployed divided by the total number in the labor force (the employed plus the unemployed).
| A person is Unemployed if he/she had no employment during the reference week, was available for work, except for temporary illness, and had made specific efforts to find employment some time during the 4-week-period ending with the reference week (or was on temporary layoff).
Unemployment Rate - number of unemployed individuals divided by the total of those employed and unemployed (the total labor force). |
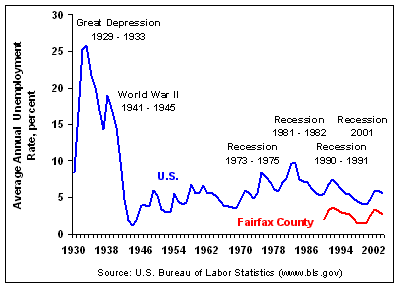
Figure 1-1. Average Annual Unemployment Rates.
This macroeconomics course may not enable you to personally take steps to lower the unemployment rate (other than your own), but it should give you a better idea as to who or what may be responsible. In fact, you may come to recognize that some government policies that purportedly save American jobs may do just the opposite.
When the average level of prices increases over time, the economy is said to be experiencing inflation. When the average level of prices declines, as it did in the 1930s, we have deflation.
| Inflation Rate - percentage increase in the average level of prices
Deflation Rate - percentage decline in the average level of prices |
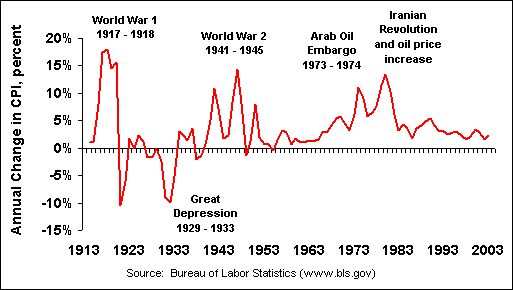
Figure 1-2. Average Annual U.S. Inflation Rates.
How is the "average level of prices" determined? Every month the Bureau of Labor Statistics sends out people to determine prices and quantities from producers, stores, and households nationwide. The prices on all the different goods and services are weighted according to total value sold or purchased to arrive at an average price, or price index. Of course the devil is in the details. There are many different price indexes and different ways of calculating each one. In a later chapter we will cover the most commonly cited measures of average prices and inflation and how they are calculated.
| GDP Deflator - an index of the average price level of all goods and services included in gross domestic product (GDP).
Consumer Price Index (CPI) - an approximate measure of the cost of living of consumers. The CPI is based on a typical "market basket" of goods and services purchased by the average household. Imports are included. Producer Price Index (PPI) - measures average level of prices received by domestic producers of commodities in all stages of processing. The PPI measures only prices received for the output of domestic industries. Imports are not included. |
It is important to recognize that we can have inflation even though the prices on some products are falling. For example, during the 1990s, the rate of inflation averaged about 4 per cent per year even though the prices of computers and other electronic products declined significantly. Price increases in some sectors of the economy must have outweighed price declines in other sectors in order for the average level of prices to rise.
Inflation isn't necessarily detrimental to everyone. Who is hurt and who benefits from inflation? Take a person who has been saving for retirement. With an unexpected increase in inflation, those savings suddenly represent less purchasing power. Retirement may no longer be as comfortable as hoped for. Now consider a young couple who has just borrowed to buy a home. With an unexpected increase in inflation they may be looking pretty good. The home they purchased may now be worth more but the loan they must repay stays the same. Those with savings are hurt and those who are in debt benefit. For individuals inflation (and deflation) is a concern because it largely represents a redistribution of wealth.
| Purchasing Power - the quantity of goods and services that can be purchased with a given amount of money. Purchasing power declines as the average level of prices rise. |
The redistribution of wealth with inflation or deflation does not represent the macroeconomic problem of price instability. Do you save or do you borrow? Price instability introduces uncertainty, which depresses overall economic activity.
Not only do goods and services have prices related to them, but money also has a "price." What would it cost you to stash $1,000 in your mattress? What does it cost you to borrow a $1,000 from a bank? The price of money is the nominal interest rate. Macroeconomics examines supply and demand and the role of prices, as well as savings and investment and the role of interest rates.
Interest rates are related to price inflation. Let's say you have some money in the bank earning 7 percent interest (the "nominal" interest rate). If the rate of inflation is 10 percent per year, are you better or worse off? Well, you may feel better because you have some money in the bank available for emergencies, but the average cost of goods and services is rising faster than the value of your savings. In this case the real interest rate (the nominal interest rate adjusted for expected inflation) may be negative indicating that the purchasing power of your bank deposit is actually declining.
| Nominal Interest Rate - the market interest rate that is paid by borrowers to lenders.
Real Interest Rate = nominal interest rate minus the expected rate of price inflation. |
| The distinction between nominal and real will be an important one in this course. Here we distinguish between nominal and real interest rates. Below we describe the difference between nominal and real GDP. A nominal value is defined as "face" value or market value (a value that is agreed to between a buyer and seller). A real value, on the other hand, is a calculated value. Generally, the difference between nominal and real in economics relates to correcting for price inflation. |
If you don't own a home you probably don't have a good feel for what interest rates can cost you. In 2003, the median price of a home in the U.S. was $187,600 (U.S. Census Bureau, Current Construction Reports). The 2003 average interest rate on a 30-year fixed rate mortgage was 5.83 percent (Freddie Mac). Monthly payments on a 5.83 percent loan for a $187,600 home would be $1,104 per month (on top of this add property taxes, insurance, etc.). Mortgage rates in 2003 were the lowest since at least 1971. In 1981, the average mortgage rate was 16.6 percent. Payments on a 16.6 percent loan for a $187,600 home would total $2,613.72 per month, well over double! Each 1 percent increase in the mortgage loan rate raises the monthly interest payment for the average price home by about $140 per month.
Not only may high interest rates depress home buying and other investment, but also changes in interest rates, whether up or down, create uncertainty and disrupt markets.
A primary measure of the health and welfare of an economy is the growth rate of real GDP, or total physical output of the economy. Because of a steadily growing population, the accumulation of real capital (investment), new technology that contributes to increases in productivity, and other factors such as education we expect growth in real GDP over the long run. The production possibilities frontier, more commonly called full-employment output or potential GDP, is steadily moving outwards. For example, real GDP in the United States has grown by an average 3.4 percent per year over the last 50 years. Over the short term real GDP growth rates are observed to cycle around this long-term trend. The economy is sometimes growing faster and sometimes slower.
Total output is measured by the market (dollar) value of all final goods and services produced by an economy during a given period of time, usually a year. Why do we measure output in dollar value rather than actual physical units of output? Quite simply, you can't add production of 1,000 cars to the production of 10,000 dolls and say we produced 11,000 goods. But, if we take quantities times market prices, we can say we produced $20 million worth of cars and $100 thousand worth of dolls for total output of $20.1 million.
A nation's aggregate output is most commonly measured by two very similar concepts, called gross domestic product (GDP) and gross national product (GNP).
| Nominal Gross Domestic Product (GDP) - the market value of final goods and services (i.e., sold to final consumers) produced by a nation during a specific period, usually 1 year
Nominal Gross National Product (GNP) - the market value of final goods and services produced by labor and property supplied by the residents of a nation during a specific period, usually 1 year. |
The difference between GNP and GDP is the income from the goods and services produced abroad using the labor and property supplied by U.S. residents less payments to the rest of the world for the goods and services produced in the United States using the labor and property supplied by foreign residents (referred to a net factor payments from abroad). In a simple example, the profits of a Toyota plant in Tennessee would be included in GDP, but not GNP; while the profits of a Ford Motor plant in Mexico would be included in GNP, but not GDP.
What's the significance of the usually small difference between GNP and GDP? If all you own is your own labor, then what you are probably most interested in is the growth of output and the related job opportunities within the U.S. That would include the Tennessee Toyota plant, and you may care little about the Ford plant in Mexico. On the other hand, if you are a wealthy capitalist and your health and welfare depends on the Dow Jones Industrial Average (the stock market), then you are probably more interested in the output of U.S. firms, no matter where their production plants are located. Because our economic models and government policies are generally limited to domestic operations, GDP is usually the favored measure of total output.
Some countries are much more sensitive to the differences between GNP and GDP than the U.S. Countries that have many citizens working abroad may have a much larger GNP than GDP. The reason is that remittances sent home by workers abroad are part of a country's GNP but not its GDP.
There's one significant problem in measuring any economic aggregate in monetary (dollar) terms. Prices change. For example, if we produced $1 billion worth of cars last year, and $1.1 billion dollars worth of cars this year, did the number of cars produced increase? Not necessarily. If the average price of cars increased by more than 10 percent, then actual physical (real) output declined, even though the total current (nominal) value of output increased. We can (approximately) correct for inflation and derive values of economic aggregates (e.g., GDP, income, consumption expenditures, investment, net imports, etc.) in real terms. The method for correcting nominal measures to real measures will be covered in the same chapter as the calculation of inflation indexes.
| Real GDP - value of total output (nominal GDP) corrected for any changes in prices
Economic Growth - change in the physical output of an economy, typically measured as the change in Real GDP. |
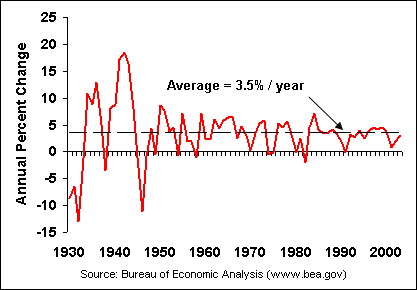
Figure 1-3. Annual Change in U.S. Real GDP.
One feature of the economy that has fascinated economists are the recurrent cycles of booms and busts in economic growth (as well as unemployment and inflation) called business cycles. Business cycles are recurring patterns of economic expansion (increasing economic growth and price inflation), then contraction (declining economic growth and growing unemployment), then expansion again. These two phases are punctuated by a peak at the end of an expansion when a contraction starts and a trough at the end of a contraction when an expansion begins again.
We can see how the economy swings around a long term trend. Figure 1-4 presents real GDP per capita to eliminate the contribution of population growth to economic expansion. Compare the long-term average growth rate of 2.3 percent per year in GDP per worker inFigure 1-4 with the 3.5 percent per year growth in total real GDP in Figure 1-3.
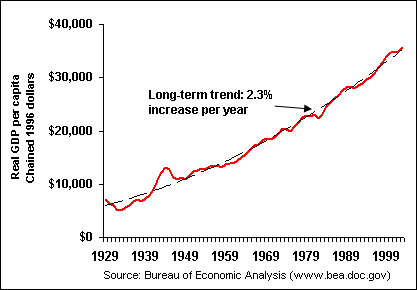
Figure 1-4. U.S. Business Cycles and Long-run Growth
The contractionary phase of the business cycle is often described as a recession. There is no firm definition of what constitutes a recession, but it is generally described as a significant decline in economic activity spread across the economy and lasting more than a few months. A recession is often casually defined as at least two consecutive quarters of negative economic growth (i.e., real output of the economy is declining) but this is not necessarily the case. For example, a small decline in real GDP not matched by a corresponding decline in employment would not be considered a recession. A severe recession in both scale and duration, such as in the 1930s, is called a depression.
| Business Cycle - Recurrent, systematic fluctuations in the level of business activity, usually measured by changes in real GDP.
Recession - a period of decline in total output, income, employment, and trade, usually lasting from six months to a year. Depression - a recession that is major both in scale and duration. |
The Business Cycle Dating Committee of the National Bureau of Economic Research (NBER) at some point became the organization that declares when a recession started and ended. Although GDP is probably the best measure of economy-wide output it is measured only quarterly. The Committee also uses monthly indicators such as total non-farm employment, real personal income, aggregate hours of work, real manufacturing and trade sales data, and industrial production indexes.
Table 1-1 presents the dates of the business peaks and troughs since 1854, identified by the NBER. The contractionary period between a trough and the previous peak represents the duration of a recession or depression. The trough-to-peak period is a time of economic expansion.
| Table 1-1. Business Cycle Reference Dates and Durations | ||||
| Reference Dates | Duration in Months | |||
| Trough | Peak | Contraction | Expansion | |
| Trough From Previous Peak |
Trough to Peak |
|||
| December 1854 | June 1857 | -- | 30 | |
| December 1858 | October 1860 | 18 | 22 | |
| June 1861 | April 1865 | 8 | 46 | |
| December 1867 | June 1869 | 32 | 18 | |
| December 1870 | October 1873 | 18 | 34 | |
| March 1879 | March 1882 | 65 | 36 | |
| May 1885 | March 1887 | 38 | 22 | |
| April 1888 | July 1890 | 13 | 27 | |
| May 1891 | January 1893 | 10 | 20 | |
| June 1894 | December 1895 | 17 | 18 | |
| June 1897 | June 1899 | 18 | 24 | |
| December 1900 | September 1902 | 18 | 21 | |
| August 1904 | May 1907 | 23 | 33 | |
| June 1908 | January 1910 | 13 | 19 | |
| January 1912 | January 1913 | 24 | 12 | |
| December 1914 | August 1918 | 23 | 44 | |
| March 1919 | January 1920 | 7 | 10 | |
| July 1921 | May 1923 | 18 | 22 | |
| July 1924 | October 1926 | 14 | 27 | |
| November 1927 | August 1929 | 13 | 21 | |
| March 1933 | May 1937 | 43 | 50 | |
| June 1938 | February 1945 | 13 | 70 | |
| October 1945 | November 1948 | 8 | 37 | |
| October 1949 | July 1953 | 11 | 45 | |
| May 1954 | August 1957 | 10 | 39 | |
| April 1958 | April 1960 | 8 | 24 | |
| February 1961 | December 1969 | 10 | 106 | |
| November 1970 | November 1973 | 11 | 36 | |
| March 1975 | January 1980 | 16 | 58 | |
| July 1980 | July 1981 | 6 | 12 | |
| November 1982 | July 1990 | 16 | 92 | |
| March 1991 | March 2001 | 8 | 120 | |
| November 2001 | 8 | |||
| Average, all cycles: | ||||
| 1854-1991 (31 cycles) | 17 | 38 | ||
| 1854-1919 (16 cycles) | 22 | 27 | ||
| 1919-1945 (6 cycles) | 18 | 35 | ||
| 1945-2001 (10 cycles) | 10 | 57 | ||
| Source: National Bureau of Economic Research (http://www.nber.org) | ||||
Business cycles are often called "regular" not because they occur with predictable frequency (each cycle differs in both length and intensity) but because the inter-relationships between macroeconomic variables are quite consistent. For example, when the GDP growth rate increases the unemployment rate declines. When the growth rate of GDP is higher than the long-term trend, the rate of inflation increases. Interest rates, exchange rates, bankruptcies, industrial production, and other measures of macroeconomic performance all seem to follow cycles generally consistent with the overall business cycle.
Enacting policy to achieve one goal may also lead to the achievement of another goal. For example, the stimulation of economic growth may also lower the unemployment rate. When the achievement of one goal helps to achieve another, these goals are said to be complementary. Unfortunately, stimulating the economy to promote economic growth and lower the unemployment rate may also lead to an increase in price inflation. Economic growth (or low unemployment) and low inflation are conflicting goals. This conflict, one of many tradeoffs, is the reason economics has been described as the "dismal" science.
Achieving one of the three primary macroeconomic goals may also conflict with other goals. For example, if we wish to increase consumption by households (i.e., increase the standard of living) we may have to reduce the level of investment, which would lower long-run economic growth.
![]()
Theories are propositions about outcomes that are expected to occur under certain circumstances. A macroeconomic theory is a collection of ideas about how the aggregate economy works or should work.
Any theory is always provisional, in the sense that it is only a hypothesis; you can never prove it. No matter how many times the results of experiments (or observations of economic conditions) agree with some theory, you can never be sure that the next time the result will not contradict the theory. Each time new experiments are observed to agree with the predictions the theory survives, and our confidence in it increases. But our confidence can never be absolute. If ever a new observation is found to disagree, we may have to abandon or modify the theory.
| "Experimental confirmation of a prediction is merely a measurement. An experiment disproving a prediction is a discovery"
Enrico Fermi. |
Most economic theories are developed in terms of an economic model, that may be expressed using verbal exposition or mathematical methods (e.g., graphs, algebra, calculus, game theory, etc.).
A good economic model satisfies two requirements:
One important characteristic of useful models is that they should be simple and as easy to apply as possible. This is the principle of Occam's Razor -- cut away all the complicating details that do not significantly contribute to the reliability or validity of a model. A model should be simple because reality is too complex to understand in its entirety. Perhaps you know it as KISS - Keep It Simple Stupid.
There are two underlying principles to Occam's Razor:
1. Do not include variables or complications that do not change the implications or predictions of the model. The position of the stars may influence the behavior of some individuals; but since it doesn't influence macroeconomic outcomes, we can fortunately leave this (and many other variables) out of our macroeconomic models.
2. Isolate and hold constant extraneous variables that, while they may significantly impact the model, are not the principle interest of the theory being developed. This is often expressed by economists through the Latin phrase ceteris paribus, meaning "other things being equal." For example, in microeconomic demand theory, changes in population may significantly affect product demand, but when we want to evaluate the impact of a change in price or income on demand at a point in time we can simplify the model by assuming that population remains constant.
| "And as a man without a culture or society, he was uniquely free to apply Occam's razor, or, if you like, the Law of Parsimony, to virtually any situation, to wit: The simplest explanation of a phenomenon is, nine times out of ten, say, truer than a really fancy one."
Kurt Vonnegut, Timequake (1998). |
An empirical study is a test of a proposition or theory using actual observations or numbers. The National Income and Product Accounts and price indexes provide a rich source of observations for testing innumerable theories about how our economy has evolved over time and in comparison with other economies. These data are available not just for the nation as a whole but also for states, many large cities, and for specific industries.
Use Real rather than Nominal values. The bane of economists are news journalists who must have been bored with economics as undergraduates and skipped class. All too often we read of the horrors of how some spending is out of control. Headline -- federal government spending has increased almost 80 percent over the last 15 years! The only horror is that we are being misled. A nominal measure of spending does not indicate that more goods and services are being purchased because of the effect of inflation. After correcting for inflation, real government spending has increased by less than 8 percent. In fact, as most government employees can attest, real government spending has declined by over 17 percent since 1991. When comparing spending or income over time use real rather than nominal measures.
Compare Per Capita rather than Aggregates. If the total real (physical) output of the economy increased by 2 percent last year, were we better off (ignoring complications such as pollution, distribution of wealth, etc.)? Not necessarily, the total population may have increased by more than 2 percent so that we are now consuming less per person on average. When comparing outcomes over time (or across different countries) it is common practice to divide an economic measure like output (or income, consumption, etc.) by the total population for a per capita measure. A related question is, did each person on average produce more? Again, maybe not. The total labor force (or labor-hours) may have increased by more than 2 percent. In this situation we have more workers but less output per worker (or per labor-hour). Comparisons of aggregate output over time or across countries should be based on a common per unit measure such as per capita, per worker, per labor hour, etc..
| GDP Per Capita - total GDP (nominal or real) divided by the total population
Productivity - average output per hour of labor (e.g., total real GDP divided by the total number of labor-hours worked) |
Compare Growth Rates rather than Levels. Although growth in U.S. real GDP per capita in Figure 1-4 above appears to be relatively steady, the growth rate has been variable as we saw in Figure 1-3. Another view of this variability is the average growth rates by decade shown Figure 1-5. Generally the trend over the last six decades has been downwards. Trends in economic growth over time are difficult to discern when looking at a graph of levels as in Table 1-4. The greatest problem with looking at a graph of levels is that a straight line does not imply constant growth. The trick is that an increase from $10,000 to $15,000 is much greater (50 percent) than growth from $30,000 to $35,000 (17 percent). Similarly, a 100 point increase in the stock market's Dow Jones Industrial Average today is not nearly as dramatic as it was twenty years ago.
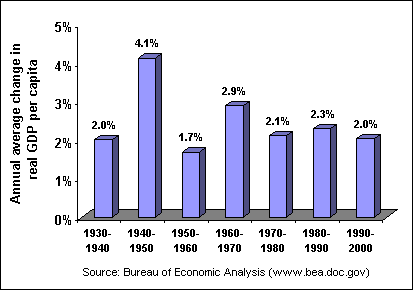
Figure 1-5. U.S. Real GDP per Capita Growth Rates, 10-year annual averages.
File last modified: August 1, 2004
© Tancred Lidderdale (Tancred@Lidderdale.com)