
|
Intermediate Macroeconomics | |
2. Measuring the Macroeconomy |
Because the macroeconomic models we will study in this course address the impacts of government policy on total output, income, and prices we will spend some time understanding how total output, income, and the average level of prices (inflation) are measured.
| "One reads with dismay of Presidents Hoover and then Roosevelt designing policies to combat the Great Depression of the 1930's on the basis of such sketchy data as stock price indices, freight car loadings, and incomplete indices of industrial production. The fact was that comprehensive measures of national income and output did not exist at the time."
Richard T. Foyen |
In the 1930's, economists at the Department of Commerce and National Bureau of Economic Research, under the leadership of Nobel Prize winner Simon Kuznets, developed the first comprehensive measures of national income. The original set of income accounts was presented to Congress in 1937 and in a research report, National Income, 1929-35. In the 1940's, World War II planning needs were the impetus for the development of product or expenditure estimates (gross national product).
Today the National Income and Product Accounts (NIPA) is the official U.S. government accounting system that keeps track of national income and national output. The purpose of this chapter is not to document all the details of the NIPA (this is available from the Bureau of Economic Analysis, www.bea.gov), but to present the basic methodology of measuring total output, income, and inflation and emphasize those components and terms that will be important to us in future chapters.
Total output is measured by the money (dollar) value of all final goods and services produced by an economy during a given period of time, usually a year. Total output includes the values of goods produced, like CD players and houses, and the value of services, like haircuts and teachers' salaries.
Why do we measure output in dollar value rather than actual physical units of output? Quite simply, it's not very meaningful to add the production of 1,000 cars to the production of 10,000 dolls and say we produced 11,000 goods. But, if we take quantities times market prices, we can say we produced $20 million worth of cars and $100 thousand worth of dolls for total output of $20.1 million. Money value provides a common measure for combining dissimilar goods and services into an aggregate measure of output.
| Table 2-1. Using Market Prices to Add Cars and Dolls | ||||||
| Quantity | times | Price | equals | Market Value | ||
| Cars | 1,000 | x | $20,000 | = | $20,000,000 | |
| Dolls | 10,000 | x | $10 | = | $100,000 | |
| Total Value of Output | $20,100,000 | |||||
The value of a nation's aggregate output is measured by two very similar concepts, called gross domestic product (GDP) and gross national product (GNP).
| Nominal Gross Domestic Product (GDP) - the market value of final goods and services produced by a nation during a specific period, usually 1 year.
Nominal Gross National Product (GNP) - the market value of final goods and services produced by labor and property supplied by the residents of a nation during a specific period, usually 1 year. |
The difference between GNP and GDP is the income from the goods and services produced abroad using the labor and property supplied by U.S. residents less payments to the rest of the world for the goods and services produced in the United States using the labor and property supplied by foreign residents (referred to a net factor payments from abroad). In a simple example, the profits of a Japanese-owned Toyota plant in Tennessee would be included in GDP, but not GNP; while the profits of a U.S.-owned Ford Motor plant in Mexico would be included in GNP, but not GDP.
| GDP | GNP | |||
| Production within U.S. by foreign-owned firms |
Included | Excluded | ||
| Production in foreign countries by U.S.-owned companies |
Excluded | Included | ||
Of course the accounting is more complicated than this when we recognize that the U.S. automobile producer (Ford) pays interest and dividend income to foreign residents who own stocks or bonds issued by the U.S. company. Those payments must be excluded from GDP since they represent the contribution of production factors owned by foreigners. Payments received by U.S. residents from stocks and bonds of foreign-based companies (Toyota) would be included in GDP. In this course we'll try not to get bogged down in these accounting details.
What is the significance of the usually small difference between GNP and GDP? If all you own is your own labor, then what you are probably most interested in is the growth of output and the related job opportunities within the U.S. That would include the Tennessee Toyota plant, and you may care little about the Ford plant in Mexico. On the other hand, if you are a capitalist and your health and welfare depends on the the stock market then you may be more interested in the output of U.S. firms, no matter where their production plants are located. Because our economic models and government policies are generally limited to domestic operations, GDP is the favored measure of total output.
Some countries have much larger differences between GNP and GDP than the U.S. Countries that have many citizens working abroad may have a much larger GNP than GDP. The reason is that remittances sent home by workers abroad are part of a country's GNP but not its GDP.
| GDP and GNP are measured on a quarterly basis. Usually, when quarterly figures are reported in the press they are reported as "seasonally adjusted annual rates." This means the raw quarterly numbers are "seasonally adjusted" and then multiplied by four.
What does seasonally adjusted mean? Usually total sales (GDP) during the fourth quarter of the year (October through December) is larger than the first quarter (January through March) because of Christmas. Consequently we shouldn't be alarmed when sales and GDP decline after every Christmas season (usually by about 8 percent). It always happens. What we should be interested in is if the decline is larger or smaller than normal. To make quarter-to-quarter comparisons meaningful we seasonally adjust the numbers. For example, if based on past experience and after adjusting for economic growth, fourth quarter sales are usually 4 percent larger than annual average and the first quarter is 4 percent lower than the annual average we would divide the fourth quarter raw GDP figure by 1.04 and multiply the first quarter by 1.04. The seasonally adjusted GDP figures would then indicate what an annual average GDP might be if sales continued to follow the normal seasonal pattern. Strength or weakness in the economy can then be more easily identified. The actual procedure used is the Census X-11 (or X-12) seasonal adjustment method, which is available in most computer statistical packages. |
Many analysts make the mistake of interpreting GDP as a measure of social welfare or our standard of living. The fact that a good or service is sold implies that it is in limited supply and satisfies some human wants and needs. Presumably, as total output increases our needs are satisfied to a greater degree (assuming a rising tide lifts all boats). Unfortunately, GDP does not capture the value of all resources consumed, productive efforts, and costs of production. For example, GDP does not include the following:
First, and probably foremost, GDP omits the value of leisure time. Time is a limited resource and if its use in leisure were not highly valued, we would all be working 16-hour days, 7 days a week. If the government were to reduce the 40-hour work week there would be a decrease in GDP because of the reduction in production, income and spending. But, would we necessarily be worse off? It depends on how much a few additional hours of leisure time is valued.
Home and volunteer services are productive efforts that are not included in GDP. GDP does not include productive efforts that are not exchanged in a market (e.g., a price paid and/or income received). The services of a hired housekeeper would be included in GDP, while the identical effort of someone doing their own housework is not. Hiring a contractor to remodel your home is included in GDP, do-it-yourself remodeling is not. Volunteer charitable work, home education, child raising, and many other productive efforts for which an income is not paid are left out of GDP.
GDP does not include market transactions that are not reported to the government. The underground economy consists of transactions that are not documented for various reasons. For example, the transactions may be illegal (e.g., drugs) or income may be hidden to avoid taxes or compliance with regulations. Government statisticians do make an attempt to include an estimate of the underground economy's size, but these estimates are not included in GDP.
The value of nonrenewable natural resources like petroleum, natural gas, coal, and nonfuel minerals extracted from the ground is included in GDP in the products produced from them. But, changes in the availability of resources is ignored in the national accounts. For example, when the Alaskan oil fields fields were developed in the 1970s there was little initial impact on GDP. As oil flowed from the Alaskan fields over the next 30 years GDP has steadily benefited. It could be argued that the real contribution to the welfare of the economy was when the oil fields were first found and developed and we have since then been falsely claiming credit for past efforts. Neither the economic importance of new discoveries nor the gradual depletion of the resource base is recognized. Exploration and development generate new subsoil mineral assets just as investment creates new produced capital assets. Similarly, the extraction of mineral deposits results in the depletion of these assets just as use and time cause produced capital assets to depreciate. GDP accounts include the accumulation (a positive impact) and depreciation (a negative impact) of capital assets, but they do not similarly consider the generation and depletion of subsoil assets. Nonrenewable resources could also be thought of as inventory (discussed later in this chapter). Newly found resources could be recorded as an inventory investment and their value included in GDP. The removal or the resources would then be recorded as inventory disinvestment, which would lower GDP. The problem is that properly accounting for natural resources in the GDP accounts would be very difficult and costly.
Finally, GDP does not include costs of production that are not paid by firms and thus are not included in market prices. Pollution represents a cost or reduction in social welfare. The operating and capital costs to control or reduce pollution are included in the price of the good or service provided and the total market value of output. However, the pollution that firms are not held responsible for are not reflected in market prices and do not appear in GDP. GDP may grow because of increases in output, but the possible associated increase in pollution is not recognized.
Not only do these omissions from GDP make it inappropriate as a measure of social welfare, but they also make international comparisons of output unreliable. For example, in developing countries a larger proportion of output may come from unrecorded home production. Other countries may have a much larger underground economy.
The U.S. Bureau of Economic Analysis is taking steps to address some of these omissions such as nonrenewable resources and pollution by developing the Integrated Environmental and Economic Satellite Accounts.
![]()
There are several ways to measure the value of aggregate (total) economic output. Consider the circular flow of income and expenditures for a very simple economy.
| Figure 2-1. Circular Flow of Income and Expenditures |
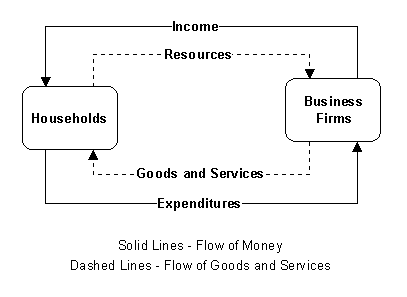 |
We can measure aggregate output by adding up the total expenditures by households. Then, if we assume that one person's spending is another person's income, an equivalent measure of the value of total output would be the total income reported by individuals. Income would include not only labor income (e.g., wages) but also income to the owners of capital (e.g., stock dividends, rents, etc.). Thus, we have two primary methods for measuring aggregate output:
This simple observation, that expenditures equals income (with certain accounting adjustments discussed below), is very important in the macroeconomic models we will present in upcoming chapters. In particular, we will assume that total output is equivalent to total income, and that the economy is in equilibrium only when total expenditures (aggregate demand) equals total income/output (aggregate supply), i.e., there is no undesired inventory build or draw. If there is a disturbance to expenditures (negative or positive) then production and income must adjust.
The expenditure approach measures total economic activity by adding the amount spent by all ultimate or final consumers of products and services. Total GDP is the sum of four categories of final demand:
GDP = C + I + G + NX
| Table 2-2. Expenditure Approach to Measuring GDP, 2003 | ||
| Billions of current dollars |
Percent of GDP | |
| Personal Consumption Expenditure (C) | 11,004 | 70.5 % |
| Durable goods | 951 | |
| Nondurable goods | 2,200 | |
| Services | 4,610 | |
| Gross Private Domestic Investment (I) | 1,666 | 15.1 % |
| Fixed investment - nonresidential | 1,095 | |
| Fixed investment - residential | 572 | |
| Change in business inventories | - 1 | |
| Government Purchases of Goods and Services (G) | 2,076 | 18.9 % |
| Federal | 752 | |
| State and Local | 1,323 | |
| Net Exports (NX) | - 498 | - 4.5 % |
| Exports | 1,046 | |
| Imports | 1,544 | |
| Gross Domestic Product (GDP) | 11,004 | - |
| Source: Bureau of Economic Analysis, Jul. 30, 2003 | ||
Consumption is probably the ultimate objective of economic activity; people work and produce in order to obtain goods and services to consume. Consumption includes all spending by domestic households on final goods and services, with the exception of housing, which is reported as residential investment (see Investment below). Consumption expenditures are grouped into three categories:
If you regularly read the business section of the newspaper your knee-jerk response to the term investment is to think of buying stocks or bonds. This is not what economists consider as investment in macroeconomic models. When you buy a stock or bond you are only purchasing an ownership share in a corporation. You are not increasing the productive capacity or the physical assets of the economy. Investment in macroeconomic models represents the flow of spending that adds to the physical stock of real capital.
| Investment in Real Capital - production and accumulation of goods for future use in production processes. |
The National Income and Product Accounts (NIPA) includes these categories of private domestic investment expenditures:
It may strike you as unusual that residential housing is included. New apartment buildings certainly represent investment because, like a factory or machine, they are intended to become income-producing assets. In future years the apartment building will produce shelter, for which the owner will charge a rent. Owner-occupied houses serve the same productive purpose; houses supply shelter in future years. In GDP accounting the family is treated as a firm that rents the house to itself. Government economists estimate what the market rent for an owner-occupied home would be if it were rented and includes this estimate (also called an imputed value) in GDP. We could also calculate rents for other durable goods like cars and furniture, which are counted as consumption, but this would make life for the economists a lot more trouble than it is worth.
Accounting for Inventory Changes. The change in business inventories is also included as investment. Inventories are stocks of unsold finished goods, intermediate goods, and raw materials held by firms. Changes in inventories (inventory investment) can be either positive or negative. If a firm produces goods that it can't sell or consume in the production process, the resulting increase in inventories counts as investment by the firm. An increase in inventories is counted as a positive investment because they will be used in a future period to produce goods for final consumption. For GDP accounting, the firm has, in effect, purchased the unsold goods from itself. A decline in inventories represents a negative inventory investment since there is a conversion of capital (inventories) to consumer goods. The negative investment should be offset by a consumption expenditure on the final goods that were produced from those inventories.
We can illustrate the effect of production to inventory on GDP with a simple example. Suppose that Ford Motor Co. produces and sells a car to one of its retailers in 1998 for $18,000. The retailer sells the car the following year (1999) to a consumer for $20,000. Nominal GDP for 1998 and 1999 are:
| GDP Account | 1998 | 1999 | |
| Consumption | 0 | $20,000 | |
| Investment (inventories) | $18,000 | - $18,000 | |
| Total GDP | $18,000 | $2,000 |
The 1998 GDP includes the value of production of the car by Ford, while 1999 GDP includes the value of services provided by the retailer in selling the car to the consumer.
Land Is Excluded. Investment does not include nonproduced assets. Two characteristics of what economists call real capital rule out land:
Financial Investment Is Excluded. As mentioned above, investment does not include the purchase of financial assets such as stocks and bonds. Financial capital is simply a piece of paper that designates a claim of ownership. A piece of paper by itself produces nothing. Your purchase of a new bond may provide the cash needed for a new piece of equipment for the firm, but the investment is not counted until the equipment is actually bought.
Government Spending Is Excluded. Finally, we should note that investment here refers to private domestic investment. We include only private investment, since government investment (roads, dams, etc.) is included as part of Government Spending (refer to next section). We include only domestic investment, since the purchase and export of real capital for investment outside the country is included as part of Net Exports (see below).
Government purchases of goods and services include federal, state, and local government spending. Although state and local government spending accounts for about 2/3 of total government spending, the macroeconomic models in this course generally refer to the federal government when considering the effects of changes in government spending on the economy.
The government is treated as a final consumer even though it acts like a firm in that it uses resources in the production of goods and services for consumption by its citizens. But, the goods and services supplied by government, such as national defense, public education, building and maintenance of roads, generally have no market prices (e.g., "user fees") associated with them. The solution that has been adopted is that government production is valued at the cost of production. This implies that GDP may increase as government functions become privatized. In other words, both the cost of production and profits of private firms show up in prices and GDP, while the imputed price of government output is not credited with any profit. Of course, this assumes that the cost of production would not be reduced with privatization.
There is a significant exception when accounting for government expenditures. The government may spend money for which it does not receive any good or service in return. Transfer payments, such as social security benefits, unemployment compensation, and various welfare benefits, are excluded from government spending in GDP accounting because they do not reflect productive activity in the period in which they occur. Similarly, interest payments on the national debt are not counted as part of government spending in the GDP accounts.
| Transfer Payment - a payment made for which no goods or services are provided in return. Transfer payments are excluded from GDP. |
Net exports equals exports minus imports. Net exports are positive if exports are greater than imports (a trade surplus) and negative if imports exceed exports (a trade deficit).
Exports are included as a positive addition to GDP because exports are final goods and services produced within the country that are purchased by foreigners. It is interesting to note that a good or service doesn't actually have to leave the country to be counted as an export. For example, a German tourist visits New York and rents a hotel room, hires a taxi, and eats meals. Since these goods and services have been produced by Americans, they are counted as part of GDP. Since they are paid by a foreigner, they are considered an export.
The consumption, investment, and government spending categories include spending on imported goods. Rather than subtract out the imported component from each of these categories, the national income accounts simply subtract out imports as a lump sum.
There are several measures of aggregate income. One measure is National Income (NI), which is the sum of incomes that originate in the production of goods and services from labor and property supplied by U.S. residents. A second aggregate measure is Personal Income (PI), which is income received by persons from all sources. National Income and Personal Income differ in two major respects:
| Table 2-3. Comparison of National Income and Personal Income, 2003 | ||
| National Income |
Personal Income | |
| Compensation of employees | ||
| Wage and salary accruals | 5,104 | 5,104 |
| Supplements to wages and salaries | 1,186 | 1,186 |
| Proprietor's income | 834 | 834 |
| Rental income | 154 | 154 |
| Corporate profits | 1,021 | - |
| Net interest | 543 | - |
| Taxes on production and imports less subsidies | 751 | - |
| Business transfer payments | 78 | - |
| Current surplus of government enterprises | 10 | - |
| Personal interest and dividend income | - | 1,323 |
| Transfer payments to persons | - | 1,335 |
| Less: Personal contributions for social insurance | - | (773) |
| Total Income | 9,680 | 9,162 |
| Source: Bureau of Economic Analysis, Jul. 30, 2004 | ||
A third important measure of income is Disposable Personal Income (DPI). Not all Personal Income is available to households to spend. The government takes a large cut in the form of income tax and withholding for social security (a future transfer payment).
| Personal Income (PI) |
| - Personal Income Taxes |
| - Social Security Withholding |
| Disposable Personal Income (DPI) |
We do not attempt to distinguish between National Income and Personal Income in the macroeconomic models in this course. In fact, in the interest of working with as simple a model as possible, we will also ignore the differences between these income measures and Gross Domestic Product. As mentioned earlier, we will assume that aggregate supply is equivalent to total income. The distinction between total income and disposable income is important, though, as we consider the effects of changes in personal taxes on consumption demand and the economy.
| Table 2-4. Relationship Between National Income, GDP and GNP, 2003 | ||
| Billions of current dollars |
Percent of GDP | |
| National Income | 9,680 | 88.0 % |
| Plus: Statistical discrepancy | 26 | 2.4 % |
| Equals Net National Product (NNP) | 9,705 | 88.2 % |
| Plus: Depreciation | 1,354 | 12.3 % |
| Equals Gross National Product (GNP) | 11,059 | 100.5 % |
| Less: Income received from rest of world | (329) | 3.0 % |
| Plus: Income payments to rest of world | 274 | 2.5 % |
| Equals: Gross Domestic Product (GDP) | 11,004 | - |
| Source: Bureau of Economic Analysis, August 5, 2004 | ||
![]()
Inflation (or deflation) is derived from a price index. A price index is a number that shows how the average level of prices has changed over time.
A price index does not directly measure the average level of prices. For example, suppose we sell one car at $20,000 and one doll at $20. Is the average price level $10,010? If the next year well sell one car and two dolls, does that mean the average price level then declines to $6,680 ($20,040 total sales divided by 3 products sold). Because we can't construct a meaningful average price level, we create an index that measures changes in the average level of prices.
To create a price index we (arbitrarily) assign one year as the base year. We determine all changes in prices from that base year then weight the change in price for each good by the value of that good sold. The price index for the base year is (again arbitrarily) assigned a value of 100. The price index for years other than the base year indicates the change in the average level of prices between any year and the base year, which can be expressed as percentage changes.
| Inflation - increase in the average level of prices.
Deflation - decline in the average level of prices. Price Index - a measure of the average level of prices for some specified set of goods and services, relative to the prices in a specified base year. |
There's one significant problem in measuring any economic aggregate in monetary (dollar) terms. Prices change. For example, if we produced $1 billion worth of cars last year, and $1.1 billion dollars worth of cars this year, did the number of cars produced increase? Not necessarily. If the average price of cars increased by more than 10%, then actual physical (real) output declined, even though the total money (nominal) value of output increased.
We can (approximately) decompose changes in nominal economic aggregates (e.g., GDP, income, consumption expenditures, investment, net imports, etc. measured in monetary terms) into that part due to changes in prices and that part due to changes in quantities. One way to eliminate the effect of price changes is to measure the total value of output in each period by using prices from some base year. Then any change in the total value of output (using base year prices) might be attributed to changes in quantities and not changes in prices.
| Real GDP - value of total output corrected for any changes in prices. Also referred to as "constant-dollar" |
The first step in calculating real GDP is to pick a "base" year. The choice is arbitrary. The objective is to take a snapshot of market prices at some point in time and to apply those prices to the quantities of goods sold in different years. From time-to-time a new base year is selected because there are products marketed today that may not even have been conceived of 10 years ago. It would be hard to evaluate the value of total output today using 1970 prices.
Table 2-6 presents a sample calculation of real GDP for the years 1992 and 1994 assuming 1992 is the base year. Real GDP for 1992 is 1992 quantities times 1992 base year prices. Real GDP for 1994 is 1994 quantities times 1992 base year prices.
| Table 2-6. Calculating Real GDP (Base Year = 1992) | |||||||||
| Average Prices | Quantity Sold | 1992 Nominal GDP |
1992 Real GDP |
1994 Nominal GDP |
1994 Real GDP | ||||
| 1992 | 1994 | % change | 1992 | 1994 | |||||
| Food | $ 12 | $ 14 | 17 % | 4 | 5 | $ 48 | $ 48 | $ 70 | $ 60 |
| Housing | 9 | 10 | 11 % | 3 | 3 | 27 | 27 | 30 | 27 |
| Fun | 4 | 5 | 25 % | 3 | 4 | 12 | 12 | 20 | 16 |
| Machines | 20 | 20 | 0 % | 2 | 2 | 40 | 40 | 40 | 40 |
| $127 | $127 | $160 | $143 | ||||||
| 1994 Nominal GDP = | sum of [1994 (current year) Prices x 1994 (current year) Quantities] |
| = | ($14 x 5) + ($10 x 3) + ($5 x 4) + ($20 x 2) |
| = | $70 + $30 + $20 + $40 |
| = | $160 |
| 1994 Real GDP = | sum of [1992 (base year) Prices x 1994 (current year) Quantities] |
| = | ($12 x 5) + ($9 x 3) + ($4 x 4) + ($20 x 2) |
| = | $60 + $27 + $16 + $40 |
| = | $143 |
Recognize that the 1992 Nominal GDP is exactly the same as the 1992 Real GDP because 1992 is the designated base year. In other words, in 1992 "current" prices and "base year" prices are identical:
| 1992 Real GDP = | 1992 Nominal GDP |
| = | ($12 x 4) + ($9 x 3) + ($4 x 3) + ($20 x 2) |
| = | $48 + $27 + $12 + $40 |
| = | $127 |
Having calculated the 1992 and 1994 real GDP figures we can now determine if our economy grew or contracted. An increase in nominal GDP really tells us nothing because we don't know if the increase was due to higher prices or more physical output. Because the change in prices has been eliminated in the calculation of real GDP, an increase in real GDP tells us that our economy actually expanded. In our example, the economy grew by 12.6% between 1992 and 1994:
| Change in Real GDP, percent = | (Real GDP Year 2 - Real GDP Year 1) * 100 |
| Real GDP Year 1 | |
| = | (143 - 127) * 100 |
| 127 | |
| = | 12.62 % |
Having identified the "real" part of GDP we can now calculate the price change part. The GDP Deflator (also known as the Implicit GDP Deflator or Implicit Price Deflator) is a price index that represents the change in the average level of prices of all goods and services produced in an economy (i.e., included in GDP). The GDP deflator is measured by comparing the current value of total output (nominal GDP) to the value of the output if prices had not changed from the base year (real GDP).
GDP Deflator - the economy's aggregate price index, equal to the ratio of nominal GDP to real GDP.
     GDP Deflator = Nominal (current-dollar) GDP * 100
Real (constant-dollar) GDP |
The GDP Deflator is described a variable-weight price index because the goods and services covered change from year-to-year. For example, the 1997 GDP deflator is based on a comparison of the total value of all goods and services produced in 1997 with what those same goods and services would have cost using base year prices. The 1998 GDP Deflator, on the other hand, makes the same calculation but uses 1998 quantities and prices (and base year prices).
| 1994 GDP Deflator = | 1994 Nominal GDP |
| 1994 Real GDP | |
| = | sum of [(current prices) x (current quantities)] * 100 |
| sum of [(base year prices) x (current quantities)] | |
| = | ($160 / $143) * 100 |
| = | 111.9 |
The GDP Deflator (and any price index) is equal to 100 in the base year:
| 1992 GDP Deflator = | 1992 Nominal GDP |
| 1992 Real GDP | |
| = | ($127 / $127) * 100 |
| = | 100 |
Inflation (or deflation) is then calculated as the percent change in the GDP Deflator:
| Inflation Rate, percent = | (GDP Deflator Year 2 - GDP Deflator Year 1) * 100 |
| GDP Deflator Year 1 | |
| = | (111.9 - 100) * 100 |
| 100 | |
| = | 11.9 % |
Inflation Rate - percentage rate of increase in the price index per period.
     Inflation = Price Index Year 2 - Price Index Year 1 * 100
Price Index Year 1 |
An alternative measure of price inflation is the Consumer Price Index (CPI). The CPI is a specialized measure of inflation in that it measures only the inflation rate of goods purchased by the typical household. It excludes some products covered by the GDP Deflator such capital goods purchased by firms and goods and services purchased by the government. But the CPI includes household purchases of imports that are excluded from GDP and the GDP deflator.
| Consumer Price Index (CPI) - an approximate measure of changes in the cost of living of consumers. The CPI is based on a typical "market basket" of goods and services purchased by the average household. The CPI is calculated and reported monthly by the Bureau of Labor Statistics (http://www.bls.gov) |
One significant characteristic of the CPI is that the goods and services included in the index are assumed not to change over time. Consequently, the CPI is described as a fixed-weight price index, which measures the cost of a fixed basket of goods relative to a base period. In other words, the quantities of goods and services included in the CPI do not change from year-to-year as they do in the GDP Deflator. The market basket of goods in the CPI is based on the Consumer Expenditure Survey, which is conducted about once every 10 years. The most recent survey of over 30,000 families was conducted over the period 1993 - 1995.
| 1994 CPI = | sum of [(current prices) x (fixed market basket quantities)] * 100 |
| sum of [(base year prices) x (fixed market basket quantities)] |
Assume in the simple economy in the table above that 1992 is the base year and that the quantity of food, housing, and fun sold in 1992 represents the quantities in our fixed market basket of goods (machines are excluded because they are purchased by businesses and not households). Since 1992 represents both the base year for prices and the quantities of goods in our fixed market basket, we know that the CPI for 1992 equals 100. We can then calculate the CPI for 1994:
| 1994 CPI = | ($14 x 4) + ($10 x 3) + ($5 x 3) * 100 |
| ($12 x 4) + ($9 x 3) + ($4 x 3) | |
| = | ($101 / $87) * 100 |
| = | 116.1 |
| Inflation, % = | (CPI Year 2 - CPI Year 1) * 100 |
| CPI Year 1 | |
| = | (116.1 - 100.0) * 100
100 |
| = | 16.1% |
Note: In the CPI calculation machines are not included because they are not "consumer" item
| GDP Deflator | Consumer Price Index | |
| Basket of goods | All goods | Fixed basket of Consumer goods |
| Include imports? | No | Yes |
| Does basket of goods change? |
Yes - current quantities | No - fixed (base year) |
The traditional calculation of the GDP Deflator and the Consumer Price Index presented above causes two significant problems:
Extensive research in price index theory has developed a number of alternative indexes that have characteristics that are preferable to the traditional GDP deflator and CPI measures described above. Unfortunately, there is no perfect or even best index. The CPI Advisory Commission (aka Boskin Commission) appointed by the U.S. Senate in 1995 concluded the CPI overstates the change in the cost of living by about 1.1 percentage points per year. That is, if inflation as measured by the CPI is 5%, the true increase in the cost of living is about 4 percent. The Commission recommended inflation indexes should change from fixed-weight formulas to a moving base year method that accommodates consumer substitution.
The Bureau of Economic Analysis switched to a chain-type index, also known as a Fisher index, in 1996 for calculating changes in real GDP, chained-dollar estimates of GDP, and the implicit price deflator. Each year a quantity index and price index are calculated using a moving base year. For example, the 1993-94 change in real GDP (quantity index) is calculated using 1993 and 1994 prices. Similarly, the 1993-94 change in the average level of prices (price index) is calculated using 1993 and 1994 quantities. A time series of chain-weighted GDP (i.e., real GDP) is then created by multiplying a base year (1992) nominal GDP by the subsequent chained (multiplied) quantity indexes.
Beginning in January 1999, the Bureau of Labor Statistics converted from the traditional method for calculating the consumer price index to a geometric mean method in index categories that account for about 61 percent of total consumer spending represented by the CPI. In contrast to the fixed quantity weights of the current CPI arithmetic mean formula, the geometric mean estimator employs a set of fixed expenditure proportions as weights to be used in averaging the prices of individual items within a CPI basic index. Fixing the relative expenditure proportions, rather than the relative quantities, implies that consumers can alter the quantities of goods and services they buy—albeit within the narrow range of a CPI category—when the relative prices of those goods and services change.
| For more comprehensive explanations of the problems with price indexes and a description of chain-weighted price indexes refer to the analysis reports published by the Bureau of Economic Analysis (http://www.bea.gov) and the Bureau of Labor Statistics (http://www.bls.gov). A very good discussion is also available in a series of articles published in the Journal of Economics Perspectives, Winter 1998 (Volume 12, Number 1). |
File last modified: August 1, 2004
© Tancred Lidderdale (Tancred@Lidderdale.com)